

Quick Summary: The Cost Performance Index (CPI) is your project's financial early warning system—signaling whether you’re over budget, on track, or operating efficiently. But in 2025, it’s more than just a cost metric. CPI becomes a strategic asset when combined with predictive intelligence—helping leaders detect cost risks up to six weeks in advance, reduce overruns by as much as 35%, and align delivery with business goals.
Despite widespread use of established project controls like the Cost Performance Index (CPI), persistent cost overruns plague capital projects worldwide. As McKinsey reports:
“Our research finds that the average capital project runs approximately 60 percent over schedule and more than 70 percent over budget… McKinsey analysis from 2022, covering more than 500 projects worldwide since 2000, found that for the average large capital project, the cost overruns amounted to $1.3 billion.”
Even projects that meet their initial budgets can fail—shaking stakeholder trust, delaying initiatives, and limiting future funding. Why? Because traditional metrics like CPI are often used retrospectively, not strategically.
CPI is frequently treated as a static indicator—one that reflects what happened, rather than what’s about to. But delays in cost detection translate into missed opportunities for intervention, especially in high-stakes, high-velocity environments.
This guide reframes CPI as a forward-looking asset. You’ll learn how to apply it in context, enhance it with predictive analytics, and use it to lead—not just report.
Why Projects Still Overrun Budgets?
Common causes of project budget deviation aren’t new—but the inability to anticipate them early enough is what keeps projects vulnerable:
- Poor Forecasting - Estimates fail to account for dynamic variables like market volatility, delivery velocity, or interdependencies.
- Scope Creep - Shifting requirements and priorities inflate costs and disrupt planned allocations.
- Lack of Real-Time Visibility - Without timely data, risks are spotted only after thresholds are crossed—when correction becomes costly.
These issues compound over time—reducing confidence, stalling delivery, and weakening portfolio performance. This is where CPI—augmented with predictive insight—can shift from passive metric to proactive signal.
With the right predictive project solutions, CPI doesn’t just tell you where you are. It signals where you’re headed—and when it’s time to act.
Want to see how early CPI insight changes decision-making? Schedule a walkthrough of TrueProject’s predictive oversight in action.
What is Cost Performance Index (CPI)? - Formula, Meaning & How to Use It
CPI answers a fundamental leadership question: Are we getting the expected value for every dollar spent? It reflects the efficiency of your project spend—by comparing the budgeted value of completed work against the actual cost incurred.
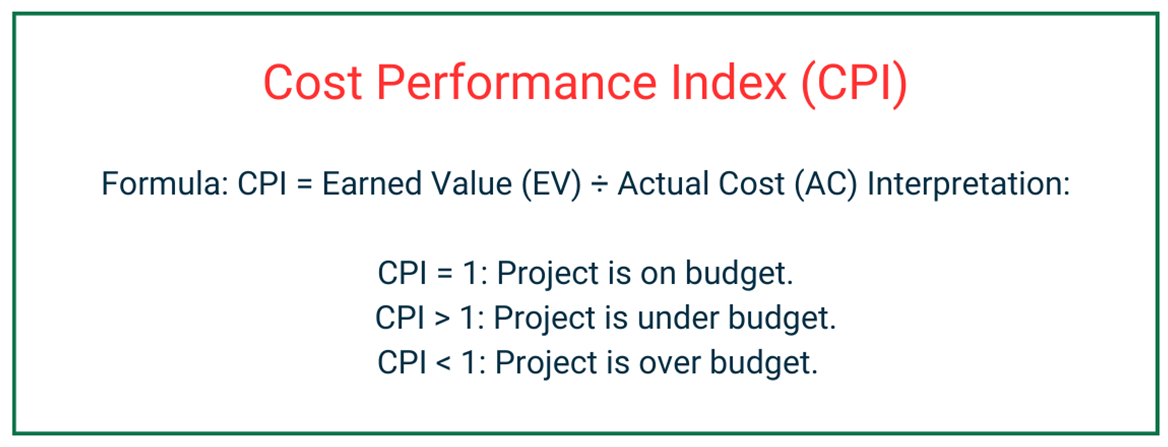
Formula:
CPI = Earned Value (EV) ÷ Actual Cost (AC)
- EV (Earned Value): Budgeted value of completed work
- AC (Actual Cost): Total cost spent to date
How to interpret CPI:
- CPI = 1.0 → On budget
- CPI > 1.0 → Under budget (cost-efficient)
- CPI < 1.0 → Over budget (inefficient spend)
Example:
If EV = $250,000 and AC = $300,000, your CPI is 0.83. That means for every $1 spent, you're generating only $0.83 in value—a signal to investigate where costs are slipping.
But CPI alone isn’t enough. Without context, trends, and predictive foresight, it simply reports what’s already happened. Leaders need tools that turn CPI into insight.
Want to go beyond static metrics? Explore how TrueProject Snapshot applies predictive oversight to CPI—so you can detect cost concerns earlier and respond faster with confidence.
Why CPI Matters
CPI isn’t just a metric—it’s a strategic signal that reveals whether resources are driving meaningful outcomes. When inefficiencies go unchecked, they delay initiatives, reduce confidence, and lead to missed opportunities.
With predictive intelligence, CPI moves beyond reporting past spend. It helps leaders detect risks sooner, realign faster, and keep execution tied to strategy.
From Reactive to Predictive: Elevating CPI’s Role in Project Management
CPI is traditionally a lagging indicator—a rearview mirror reflecting past cost performance. But in today’s high-stakes projects, where timelines are compressed and expectations are high, that’s not enough.
Limitations of Reactive CPI:
- Delayed Detection - Cost overruns surface only after damage has been done.
- Lack of Context - CPI alone doesn’t explain why inefficiencies happen.
- No Forecasting - It doesn’t help predict or prevent future budget issues.
This reactive approach leaves leaders firefighting instead of steering. But when you apply predictive intelligence to CPI, the narrative changes.
Transforming CPI With Predictive Power:
- Model Scenarios - Visualize how staffing, scope, or resource decisions affect cost efficiency.
- Act Earlier – Early warning signals before thresholds are crossed, enabling pre-emptive budget realignment.
The solution is not just more reporting, but smarter foresight. According to McKinsey,
“The innovative combination of new ways of working and powerful advanced analytics tools creates an opportunity to reduce project costs and overruns by as much as 30 to 50 per cent.”
The shift is simple but powerful: instead of reacting after problems surface, you gain lead time to intervene, realign, and protect outcomes—before they fall off track.
See what project outcomes look like when they stop reporting delays—and start flagging risks before project impact or loss. Connect with TrueProject to bring those early signals into focus.
Why CPI is a Strategic Signal, Not Just a Metric
For project and business leaders, CPI reveals whether financial efficiency supports broader goals—like speed, scalability, and long-term viability.
CPI as a Leadership Insight:
- Resource Clarity - Shows whether investments are translating into real value.
- Risk Signal - Detects early inefficiencies so leaders can intervene before trust or outcomes are at risk.
- Decision Accelerator - Provides the evidence needed to adjust funding, resources, or delivery timelines with confidence.
Success is about connecting every dollar to a decision. Strategic oversight doesn’t start with metrics—it begins with asking the right questions.
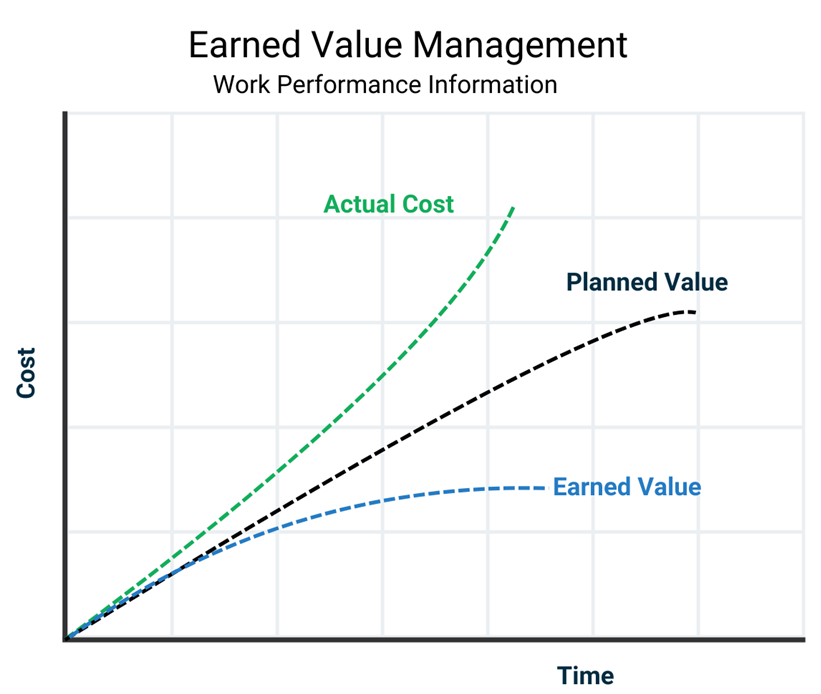
A Fresh Perspective: EVM with Predictive Analytics
Traditional Earned Value Management (EVM) metrics like CPI and SPI offer valuable snapshots—but they’re inherently reactive. They show you what already happened. Predictive analytics takes them further by adding foresight—turning these indicators into forward-looking tools that support action, not just observation.
Instead of simply flagging variances after the fact, predictive intelligence uses trend data to signal where cost efficiency or schedule integrity might slip—before it does. This shift transforms EVM into a strategic control system that helps teams’ course-correct in real time, not after it's too late.
Common Pitfalls That Undermine CPI’s Value
Despite its simplicity, CPI is often misunderstood or misused—leading to missed opportunities or misleading conclusions.
Pitfall 1: Ignoring Trends
A single CPI value doesn’t tell the full story. A reading of 1.0 may seem safe, but you can miss signs of gradual decline without tracking trends over time. Sudden spikes or drops often signal more profound operational instability.
Pitfall 2: Overlooking Context
CPI alone can't explain why performance is improving or slipping. A high CPI might suggest strong cost control—or underused resources. A low CPI could reflect poor execution—or strategic front-loading of costs. Without a broader context, the metric risks misinterpretation. Predictive tools help clarify what’s signal and what’s noise.
Pitfall 3: Delayed Action
CPI reflects what’s already occurred. If teams wait for it to dip before acting, the damage may already be done. When paired with predictive insight, CPI becomes part of a larger system that helps leaders detect emerging patterns—enabling earlier, more confident decisions.
Let’s talk about what smarter CPI oversight looks like—when it’s used to lead, not just report. Schedule a discussion today.
CPI and Predictive Analytics in Earned Value Management (EVM)
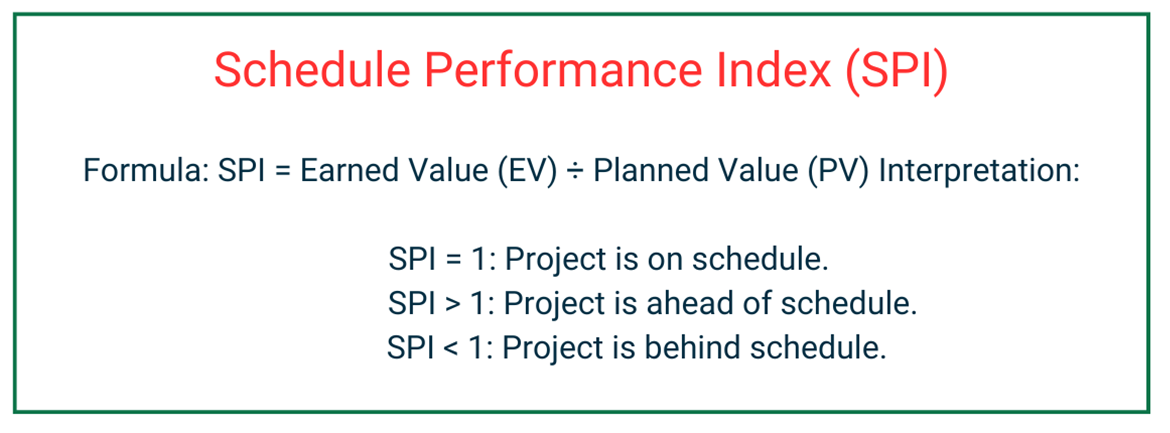
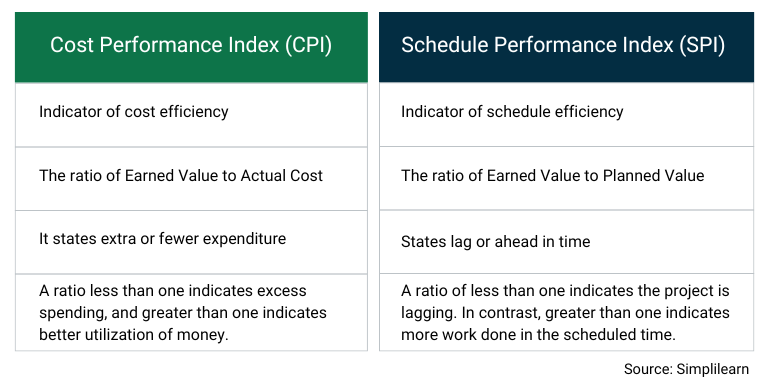
CPI and SPI are foundational to Earned Value Management—offering two distinct yet complementary views of project performance: cost efficiency and schedule progress.
Used together:
- CPI < 1 & SPI = 1: You’re over budget, but on schedule.
- CPI < 1 & SPI < 1: You’re behind on both cost and time—often a sign of deeper execution issues.
While these metrics provide structured visibility, they’re inherently retrospective. On their own, they show where you stand—not where you're headed.
When integrated into predictive systems, however, they gain new value. Forecasting overlays don’t change what CPI and SPI measure—but they help interpret shifts sooner and with more context, allowing leaders to act with greater precision and achieve have a more strategic approach to execute projects successfully.
Curious what CPI looks like when it helps you lead, not just explain? Take the QuickStart plan and see the difference the predictive shift makes to your project outcomes.
Best Practices to Optimize CPI and Drive Cost Efficiency
For CPI to inform high-stakes decisions, it must reflect cost reality—not just financial math. Below are four levers that determine whether your CPI is trusted, timely, and decision-ready:
- Baselines Must Reflect Execution Complexity, Not Just Cost Assumptions -CPI becomes misleading when tied to budgets that ignore operational friction. Use data from similar project types, resource performance, and delivery constraints to shape realistic cost baselines. If the benchmark is flawed, so is the signal.
- Static Monitoring Undercuts Decision Lead Time - By the time a monthly CPI report surfaces an overrun, options are limited. Real-time visibility allows leaders to detect cost inefficiencies as they emerge—while there’s still room to reallocate, renegotiate, or recalibrate before impact.
- A Good CPI Can Still Be a Bad Signal Without Context - A CPI of 1.05 may look healthy—but does it reflect true efficiency or just deferred execution? Conversely, a dip could signal proactive investment. Predictive overlays help you interpret movement, anticipate trajectory, and avoid reacting to noise.
- CPI Must Hold Up in the Boardroom - When CPI informs funding, reprioritization, or delivery trade-offs, stakeholders need confidence in how it's derived and what it represents. Equip decision-makers with CPI visualizations layered with predictive trends and operational context—not isolated figures.
When CPI is trusted, decisions move faster, risk exposure drops, and cost overruns become manageable—not surprising.
Want to see how early signals change your cost story? Let us show you what proactive CPI looks like in practice.
CPI as a Communication Tool for Business Leaders
CPI isn’t just a tracking metric—it’s a shared language leaders can use to align priorities, surface risks, and defend decisions under pressure.
Why it matters:
- Executive Alignment – A well-structured CPI framework gives finance, delivery, and strategy teams a single version of truth—so interpretation gaps don’t delay decisions.
- Timely Intervention – When CPI movements are contextualized with predictive insight, leaders gain the confidence to act early—not just react.
- Stakeholder Assurance – Transparent CPI reporting, layered with foresight, signals control—not volatility—when executive sponsors need clarity most.
Cost overruns don’t derail projects—silence and late signals do. Structured properly, CPI becomes more than a measure. It becomes the narrative that leadership can stand behind.
CPI in the Digital Age: Automation, AI, and Real-Time Decisions
CPI has evolved. Once a backward-looking metric updated manually, it’s now integrated into intelligent systems that deliver live, decision-ready signals.
What today’s leaders value:
- Standardized Accuracy – Real-time dashboards remove inconsistency, enabling CPI to reflect true cost performance across teams and tools.
- Predictive Insight – AI-driven models project future CPI trends based on delivery patterns, resourcing dynamics, and external volatility—giving leaders time to act, not just assess.
- Operational Cohesion – Modern platforms merge budget, scope, and schedule data into one view—making CPI part of a broader, forward-looking performance picture.
Executives no longer review CPI to understand what went wrong. They expect it to highlight where they’re headed—and whether costs will remain defensible along the way.
Conclusion: CPI, Predictive Intelligence, and the Future of Project Success
CPI only becomes meaningful when it drives timely, confident action—not just post-mortem analysis. For executives overseeing high-impact programs, lagging indicators alone are no longer enough. What’s needed is early visibility, contextual clarity, and decision-ready insight.
That’s where TrueProject shifts the equation.
TrueProject isn’t just another dashboard—it’s a KPI-based predictive intelligence solution built to identify early warning signs, detect deviations, and help you course-correct before impact. It equips leaders with predictive insight, real-time trend analysis, and automated visibility across teams and tools—so CPI isn’t just monitored, it’s made actionable.
Applied to CPI, this means:
- You’re not just tracking cost slips—you’re spotting the conditions that cause them
- Intervention happens earlier, before cost thresholds or confidence are breached
- Strategic alignment holds—even under pressure
TrueProject turns CPI into a source of foresight—where variance doesn’t catch you off guard, and control isn’t retrospective. It’s how leaders stay ahead of cost risk, not behind it.
Ready to see how early CPI signals can drive smarter decisions—not just better reports? Let’s explore how TrueProject brings that visibility into focus.
FAQs
Q1: What is a good Cost Performance Index (CPI) in project management?
A CPI of 1.0 or higher is considered good in project management. A CPI of 1.0 means your project is on budget, while a value above 1.0 shows cost efficiency. A CPI below 1.0 indicates your project is over budget and may require corrective action.
Q2: Why is the Cost Performance Index important in project management?
The Cost Performance Index (CPI) shows how efficiently a project uses its budget. It helps project managers and executives monitor cost performance, detect overruns early, and make better financial decisions throughout the project lifecycle.
Q3: How does predictive intelligence improve CPI analysis?
Predictive intelligence adds foresight to CPI by analyzing trends, behavior, and real-time signals. This helps project leaders anticipate cost risks, simulate scenarios, and act before budget problems escalate.
Q4: What causes CPI to fluctuate during a project?
CPI changes due to factors like scope creep, poor estimation, productivity issues, or rising costs. These affect how effectively project spending translates into progress. Analyzing trends helps distinguish temporary shifts from deeper issues.
Q5: How does TrueProject improve CPI and cost control?
TrueProject uses predictive analytics and real-time data to enhance CPI visibility. By detecting cost inefficiencies early and integrating with 1,000+ tools, it helps leaders act before overruns occur—turning CPI into a forward-looking decision tool.